Dashboard
The dashboard is designed to help Pendle users manage all of your positions. It offers a comprehensive view of your portfolio, allowing you to easily track all of your historical and current performance on Pendle itself.
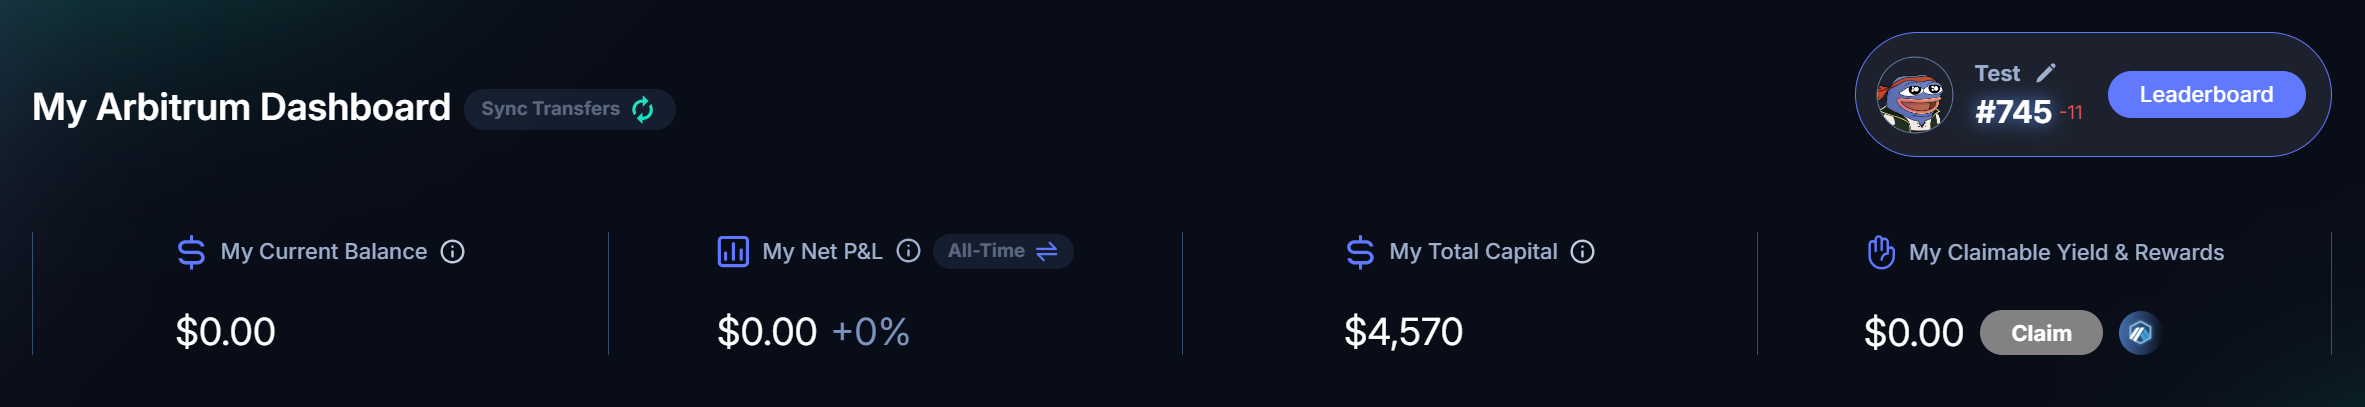
Yield and rewards accrued from any Yield Tokens (YT) and Liquidity Provision (LP) positions can also be directly monitored and claimed here.
Overview
My Total Balance
Total current, active positions on the selected chain in dollar terms
My Claimable Yield & Rewards
All of the accrued yield and rewards from YT and LP that can be claimed on the selected chain
Leaderboard
Shows your P&L ranking compared to other yield traders on the Seasonal Leaderboard. Note that only rankings ≥1000 will be shown. You can access the Leaderboard by clicking the button here.
Transfer Events
Asset Transfers to and from external parties or wallets, including deposit to liquid staking and money markets, are not synced in real time; instead, a global sync takes place periodically.
You can manually trigger a sync event on your own wallet using the Sync Transfers button, with usage limited to once every hour.
All My Positions
The lower part of the Dashboard breaks down your Pendle positions by Assets, including which active positions you hold for that particular asset (i.e. PT, YT or LP), its Total Position Value as well as P&L.

You can click on “Details” for an even more comprehensive view of the asset position, which will show you a further breakdown of your position by PT, YT and LP, alongside a dynamic P&L chart (coming soon).

The “Transactions” tab shows all the transactions related to the asset, including realized profit by transactions. Clicking on the actions (e.g. “Claim Yield” or “LP Transferred Out”) under the column will bring you to the transaction page on the blockchain explorer.

Dashboard Viewing Mode
Pendle offers two distinct viewing modes for the dashboard: USD Mode and Underlying Mode. Each mode provides a different perspective on your positions and profit and loss (P&L) calculations:
USD Mode
In USD Mode, all positions and P&L calculations are expressed in US dollars. This mode is sensitive to fluctuations in the price of the underlying assets, meaning any change in asset prices directly affects both your P&L and the value of your positions.
Underlying Mode
In contrast, Underlying Mode calculates all positions and P&L using the quantities of the underlying assets. This approach isolates your financial metrics from the volatility of asset prices; fluctuations in market prices do not impact your P&L or the valuation of your positions, which are solely influenced by transactions and events within Pendle.
Aggregate Calculations
Regardless of the selected mode, aggregate metrics such as overall P&L, the total value of positions, and capital are consistently calculated in USD. This ensures clarity and uniformity when assessing overall financial performance. The mode toggle specifically affects the display and calculation of data for individual assets.